Just the Stats : 2013-2015 Sales Trends | July 2015 Hearing Review
The Hearing Review recently asked Sikka Software to summarize some of its hearing care sales metrics, which are displayed in the real-time “National Trends Hearing Care KPI Ticker” at the bottom of the www.hearingreview.com homepage. Here is a visual summary of the data with brief notes from the company.
The performance of hundreds of dispensing practices nationwide have been tracked since 2013 by Sikka Software. This software provides a platform for small and medium-sized business healthcare apps, and is designed to help healthcare providers and other small businesses optimize their business via a series of easy-to-use cloud-based applications.
With over 32 apps built on Sikka Platform Utility® in over 14,300 installations (with about 850+ in hearing healthcare), the company is a leader in the US dental, animal health, and hearing care markets. The data is now available for real-time optimization and information networks with providers, patients, consultants, manufacturers, and financial service providers. To view the National Trends Hearing Care KPI Ticker that contains updates on much of the following information, look at the bottom of The Hearing Review website at www.hearingreview.com.

Alitta Boechler, AuD, MBA
This article reviews some of the key data and national trends tracked by the software, and mentions briefly some possible implications for future practice. Changes in practice visits and the purchasing patterns in hearing aids and accessories have implications for how a hearing practice can grow a patient base.
Complete benchmarking data, as well as dashboards and reports to maximize a dispensing practice’s profitability can be accessed by subscribing to the practice level version of the Practice Optimizer. To learn more, visit: https://www.sikkasoft.com/ hearing-care/sikka-apps/practice-optimizer-hearing-care
Average Hearing Aid Unit Sales
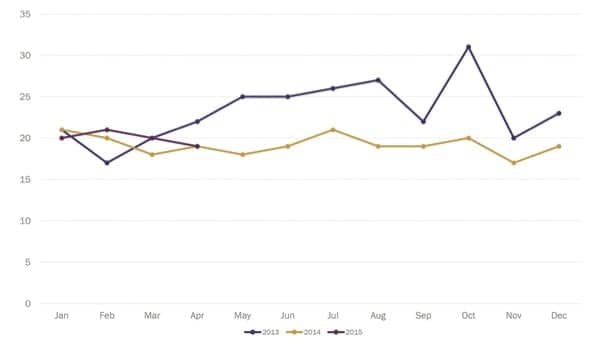
Figure 1. Average number of hearing aid units sold [Click on images to enlarge them].
Average Sales Price of Hearing Aids
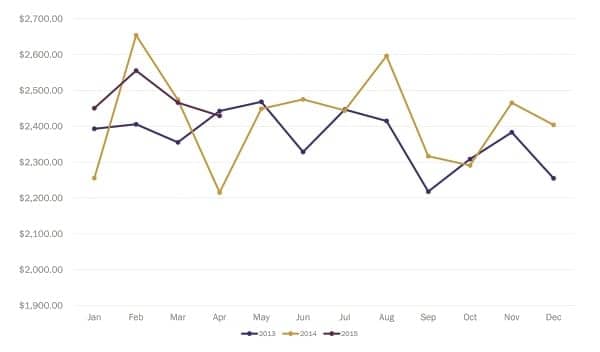
Figure 2. Average price per hearing aid unit.
Although the average hearing aid price has not changed significantly from 2013 to the present, in 2014 the national average price varied more month to month than the previous year (Figure 2). The difference between the highest and lowest average price was over $430 in 2014, compared to only $250 in 2013. This increase in variability may be the result of an increase in pricing promotions.
Premium Hearing Aid Unit Sales
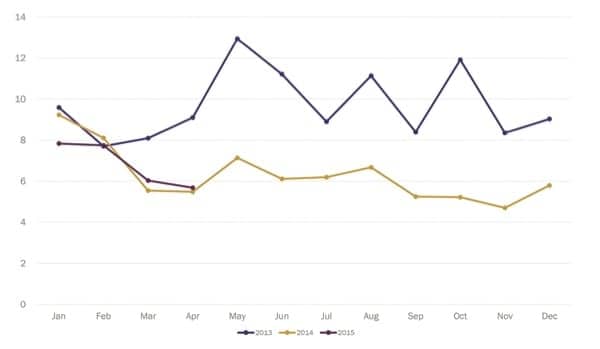
Figure 3. Unit sales of premium hearing aids.
In 2013, practices sold an average of 10 premium hearing aid units, defined as units priced above $3,000 per month (Figure 3). This compares to 6 hearing aids sold on average each month in 2014. Currently, 2015 is on trend with 2014 sales levels. This decrease in premium sales may account for most of the decrease on overall hearing aid sales over the same time period.
Hearing Aid Sales to New Patients
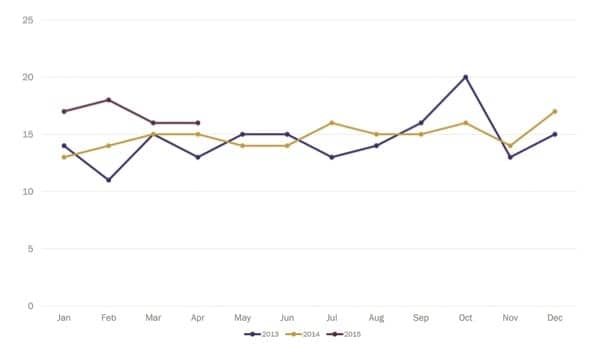
Figure 4. Hearing aid sales to new patients.
In 2015, practices sold an increased number of hearing aids to new patients (as opposed to returning patients), when compared to sales in the same months of 2013 and 2014 (Figure 4). As the total number of new patients is lower in 2015 when compared to previous years, hearing care professionals should be concerned that this revenue source may not be sustainable.
ANCILLARY SALES
Battery Sales
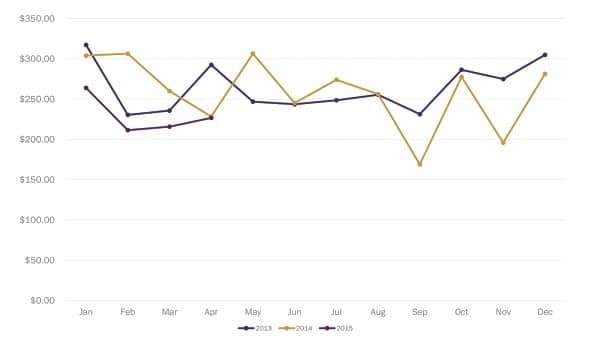
Figure 5. Battery sales (in dollars).
Data collected from January to April of 2015 indicate slightly lower revenues from battery sales than seen in previous years (Figure 5). This may reflect the high visibility of hearing aid batteries in retail outlets, as well as a global trend in online shopping.
Warranty Sales

Figure 6. Ancillary warranty sales.
So far in 2015, our data suggests the highest number of warranty sales recorded since our tracking began (Figure 6). This indicates that patients may be responding to the value proposition of warranty offerings and this service should be emphasized during the sales process.
Remotes
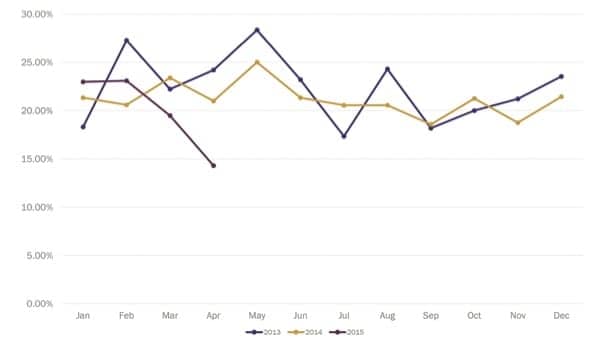
Figure 7. Ancillary remote sales.
Hearing aid remote sales increased significantly beginning in March 2013 (Figure 7). However, in 2014, sales dropped sharply, and have remained low into 2015.
This may be due to a larger number of hearing aids moving to smartphone-driven applications instead of dedicated remote control units.
Total Ancillary Product Sales
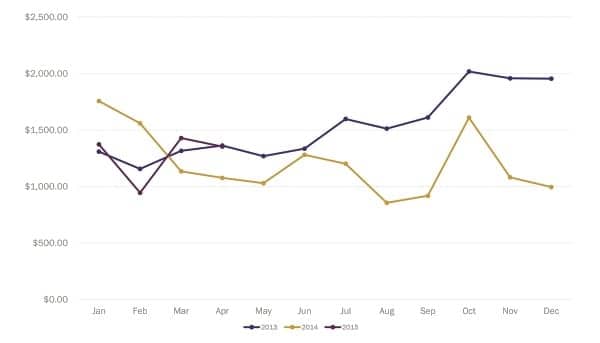
Figure 8. Total ancillary product sales (in dollars).
Individual product sales of ancillary products (ALDs, wax removal kits, dri aid kits, etc) vary greatly from month to month, as overall a low number of these products are typically sold in individual practices (Figure 8).
Looking at overall sales trends for all ancillary products, fewer of these products were sold in 2014 than the previous year.
PRODUCTION
New Patients to Patient Visits
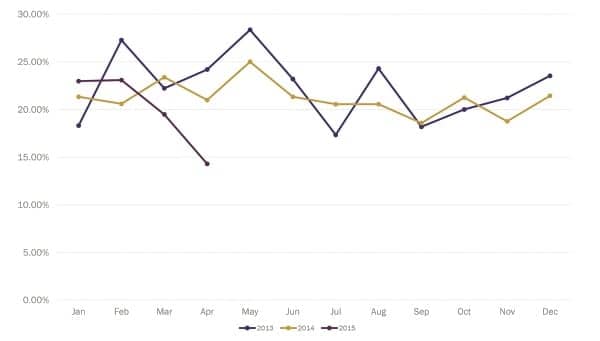
Figure 9. Percentage of new patients (new patients divided by total patient visits).
Although the total number of patients has remained steady, a sharp decrease in new patients was seen starting in March 2015 (Figure 9). If this trend continues, it could negatively impact hearing aid sales and gross production for practices this year.
Gross Production
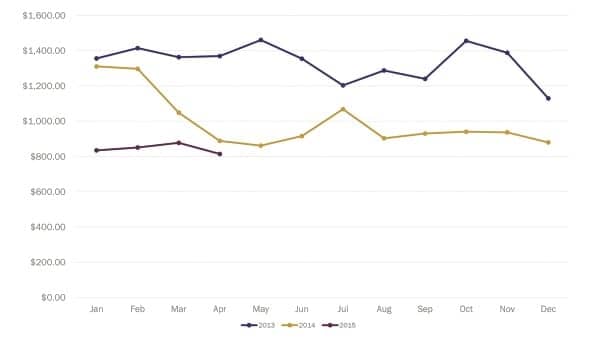
Figure 10. Gross production per customer visit.
2014 saw a decrease in gross production that has continued into 2015 (Figure 10). This is confirmed in the gross production per visit graph, were practices are now making, on average, a little over $800 per visit as opposed to over $1,400 per visit in 2013. This may be related to a decrease in premium hearing aid sales or a decrease in insurance reimbursement for services, as patient visits remained fairly consistent, or slightly better in 2015 and 2014, when compared to 2013.
Alitta Boechler, AuD, MBA, is marketing manager at Sikka Software, Milpitas, Calif. She received her AuD from the University of Iowa and her MBA from the Jesse H. Jones Graduate School at Rice University.
Correspondence can be addressed to: [email protected]
Original citation for this article: Boechler, A. Sales Trends in Hearing Care Practices: 2013-2015. Hearing Review. 2015;22(7):32.?


I have had 5 pairs of hearing aids. I started with an MD hearing aid which was the cheapest and best till I got my Phonak Q90. anyway, I have searched the web looking for basic knowledge what aids work with what (older models) for those of us that can’t afford 3000 dollar aids must buy used. simple knowledge of how to measure the length of a RIC to fit me without a card. you type in HA in any way and it sends you to every hearing center. I think the hearing industry squashes useful info to keep me deaf. took me two weeks to read between lines to find out which Aids are Bluetooth and which streamer will work with. should be a web site that is dedicated for guys that need old info for the older aids.